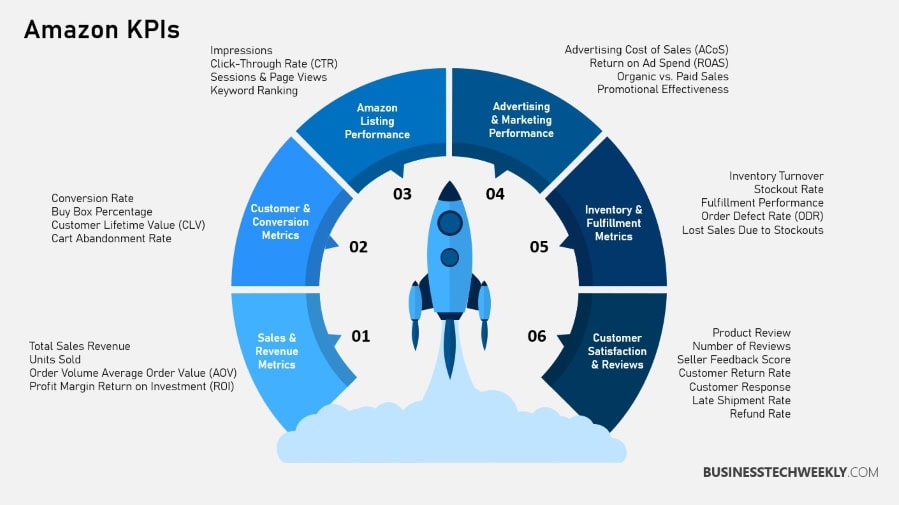
Amazon KPIs, or Key Performance Indicators, are critical metrics that offer quantifiable measures of performance for Amazon sellers. They measure your store’s performance by looking at multiple aspects.
Take their example of conversion rates, which average 9.87% on Amazon. KPIs measure the success of marketing and sales efforts, providing information on shopping cart abandonment rates and shipping patterns, for instance.
These are the indicators that allow you to determine concrete business objectives. They furthermore help get you in line with long- and short-term goals, keeping you focused.
A low ODR means you’re performing well and maintaining a good standing and reputation on Amazon.
To stay competitive, you should set a goal for at least an average conversion rate of 9.87% or higher.
Total Sales Volume
Average Conversion Rate
Order Defect Rate (ODR)
Perfect Order Percentage
Advertising Effectiveness Metrics
The organic sales percentage is an essential KPI to determine how your sales are performing without advertising support. It’s a reflection of your product listing and SEO effectiveness.
When you focus on increasing organic sales, you achieve sustainable growth by decreasing your dependence on paid ads.
Knowing what the average purchase price is for each transaction helps determine pricing strategies and what inventory to acquire.
The formula for this one is total sales / number of transactions.
Knowing this allows you to price competitively according to market demand, allowing you to make informed inventory decisions.
Customer Engagement Metrics
Sales velocity is how quickly your products are selling over time, which can help inform your inventory replenishment strategies. This is determined by product pricing, demand, and competition, among other factors.
Pricing Strategies
Product Demand
Competitive Landscape
Sales Performance Indicators
If you want to measure the effectiveness of your advertising strategies, having a solid understanding of these Amazon KPIs is key.
These metrics show the impact of your campaigns by showing a side by side view of key values vs targets.
They monitor performance over time, providing you with a better understanding of conversion rates, cart abandonment, shipping, and pricing.
Organic Sales Percentage
One important metric, ACoS (Advertising Cost of Sales), is a measure of ad efficiency. It’s determined by dividing ad spend by generated sales revenue, resulting in a percentage that shows how cost-effective ads are.
A low ACoS is critical for overall profitability, and you can easily track this with the help of Amazon’s Vendor Central and Seller Central.
Average Purchase Price Calculation
TACoS (Total Advertising Cost of Sales) measures total ad spend as a percentage of sales, serving as an important amazon KPI.
By evaluating TACoS against industry benchmarks, you gain insights into your advertising’s broader impact.
Sales Velocity Insight
RoAS (Return on Ad Spend) is a measurement that shows how much money you’re pulling in from your ad investments.
It’s easy to calculate too, simply divide your revenue by your ad spend.
A high RoAS helps you make the most of your ad budget, which means better campaign management.
Advertising Effectiveness Metrics
Understanding Amazon advertising effectiveness metrics is critical to succeeding on the platform.
It further benefits sellers by allowing them to better optimize their strategies and maximize their returns.
1. Advertising Cost of Sales (ACoS)
ACoS is a metric that tells you how efficient your advertising spend is.
Cost Per Click (CPC) is the cost you’re charged for each person who clicks on your ad.
Controlling CPC is important because it will affect your entire advertising budget.
Evaluating ACoS
ACoS = (Ad Spend ÷ Ad Revenue)
You can access your Amazon Ads data and your ACoS as follows:
Open your Seller Central dashboard > Click on ‘Reports’ > Select ‘Advertising Reports’
Smart CPC management is the key to beating your competition and getting more from your ads. You can improve CPC by experimenting with various ad formats and increasing or decreasing your bid based on results.
Whether you are working in Amazon Vendor Central or Amazon Seller Central, it is critical to monitor ACoS to spot areas that need improvement.
2. Total Advertising Cost of Sales (TACoS)
Total Advertising Cost of Sales (TACoS) takes into account advertising and organic sales.
Ad sales conversion rate is the percent of people who click an ad and then buy something.
Sellers can maximize their conversion rates by focusing on the most relevant audiences and targeting highly relevant keywords.
Comparing conversion rates, the number of people who take the desired action, is key to determining ad effectiveness. With an average conversion rate of 9.87% on Amazon, even a slightly higher target can lead to a major increase in sales.
3. Return on Ad Spend (RoAS)
Return on ad spend measures the revenue gained for every dollar spent on advertising. Cost Per Acquisition (CPA) is a measure of how much it costs to acquire a new customer.
By lowering CPA, you can spend more budget effectively while being more profitable.
Understanding CPA allows better budget allocation and maximizes marketing efforts. Amazon ROAS provides a good idea of which campaigns are profitable and should continue to receive budget vs those that shouldn’t.
4. Click-Through Rate (CTR)
Click-Through Rate (CTR) is the percentage of people who see your ad that click on it.
A high CTR indicates you’re creating relevant, engaging ad content and targeting the right audience.
Running multiple ad creatives with A/B testing can get you a better CTR. Low CTR for keywords or ASINs can help signal misalignment or unprofitable search terms.
By making sure all ads get a high CTR, advertisers can realize higher ad performance and increased ad reach.
5. Cost Per Click (CPC)
Cost Per Click (CPC) is a major factor when it comes to managing a budget.
By streamlining operations, businesses are able to cut costs and provide a better service.
Other key operational efficiency measures are inventory turnover, order accuracy, and shipping time.
Understanding and monitoring these metrics will help ensure that your advertising is improving your overall business performance.
6. Advertising Conversion Rate
A high ad conversion rate is evidence of a good ad strategy.
Keeping an eye on refund rates is key because excessive rates can seriously hurt your customer satisfaction and profits.
By analyzing refund reasons, businesses can identify areas where they can improve their product offerings and work to reduce returns.
7. Cost Per Acquisition (CPA)
Out-of-stock rates don’t just affect short-term sales, but long-term customer trust.
Effective inventory management reduces the chances of products running out.
Precision demand forecasting ensures that inventory is available and meets the needs of the customer.
8. Discount Redemption Rate
Inventory turnover ratio shows how fast a business sells its inventory.
A high turnover ratio means you are managing your inventory efficiently.
Keeping an eye on this ratio can help you keep stock to a minimum and maximize cash flow.
Credit: webretailer
Operational Efficiency Measures
Return on Investment Calculation
Calculating ROI for other initiatives is pretty simple.
You take the net profit you expect from an initiative, subtract the cost of the initiative, and divide that number by the cost. ROI = (Net Profit – Cost) / Cost.
This is one of the most important metrics when it comes to measuring the effectiveness of marketing campaigns.
It gives you definitive results on the profitability of your investments, so you know exactly what’s most effective.
Buyers need help understanding where each seller should be focusing their resources on the highest ROI activities.
This data-driven approach makes sure that our time and treasure are focused on the strategies that really yield the biggest returns.
Refund Rate Analysis
Analyzing your refund rates can provide valuable insights into customer satisfaction, making it one of the important amazon seller performance metrics.
Key performance indicators such as customer reviews, repeat purchase rates, and customer service interactions are essential in this analysis.
Understanding these critical amazon performance metrics can help you implement meaningful product improvements and refine your advertising strategies for more effective marketing efforts.
Customer Engagement Metrics
Furthermore, important customer engagement metrics include amazon views and customer feedback, which play a significant role in shaping product development and marketing initiatives.
By focusing on these key indicators, you can enhance customer acquisition and ensure that your offerings align with consumer expectations.
Continuous monitoring of these metrics will lead to better overall company performance and increased sales growth in your ecommerce business.
Ultimately, leveraging relevant kpis like the amazon product ranking kpi will allow you to make informed decisions that drive sales revenues.
By integrating these insights into your strategy, you can create a more satisfying shopping experience for your customers and improve your position on the amazon platform.
Customer Satisfaction Score
Net Promoter Score
Customer Retention Rate
Credit: webretailer
Out of Stock Rate Impact
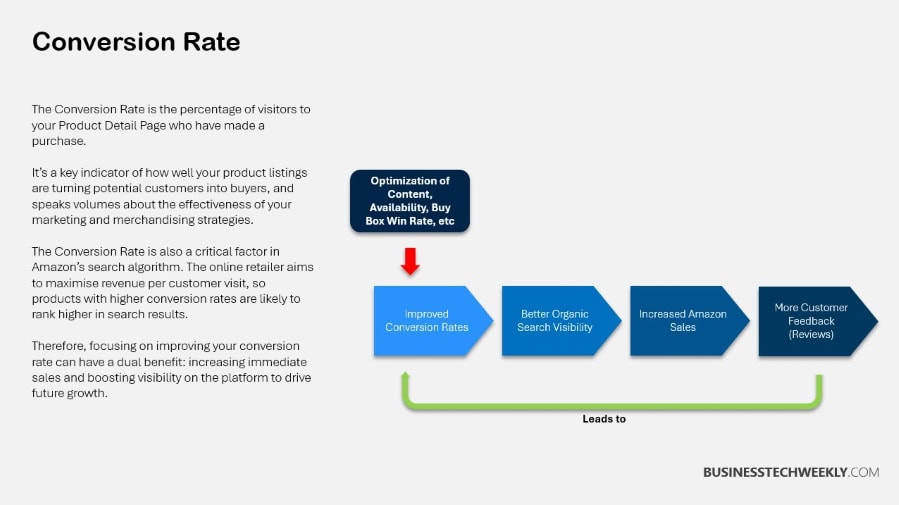
This is one of the most important metrics, it’s the conversion rate which is the % of your site visitors that buy from you.
If conversion rates and bounce rates are important to you, optimizing your product pages can speak volumes.
Consistent analysis will help you identify the pages that are underperforming, making sure that your pages are useful, engaging, and profitable.
With an average conversion rate of 9.87% on Amazon, sellers should aim to at least match this average performance.
Inventory Turnover Ratio Importance
Reviews per unit can be used as a proxy for product credibility. Positive reviews make you more visible and drive more sales.
We strongly encourage sellers to solicit feedback proactively. This increases the number of reviews and adds to the perceived credibility of the product.
More positive reviews tend to boost product rankings, thereby improving sales.
The add-to-cart rate, or the percentage of visitors who add products to their shopping cart, is another indicator of product interest. Understanding this metric can shed light on where potential buyers face barriers to purchase.
Sellers have a vested interest in knowing these rates, since it allows for better tailoring of marketing strategies and product offerings.
Order Defect Rate Management
Keeping this ODR low is critical to maintaining a positive seller performance and reputation score on Amazon.
Quick response time and follow up is important too.
Amazon suggests you keep your LSR below 4% and a pre-fulfillment cancellation rate of below 2.5%.
Evaluating Order Defect Rate & Perfect Order Percentage
Order Defect Rate (ODR) = (Number of Orders with Defects ÷ Total Orders) × 100
Perfect Order Percentage = (Number of Perfect Orders ÷ Total Orders) × 100
Keeping your ODR low – as close to 1% or less ideally – will help you maintain strong performance and reputation on Amazon.
Customer Engagement Metrics
Customer engagement metrics enable you to learn more about your business and drive decisions that lead to improved results.
By regularly monitoring, you’ll get a better sense of what’s working and what’s not.
In turn, you can make changes and improvements as you go.
Having a regular cadence of reviewing these metrics will help ensure you don’t fall behind and get blindsided.
Conversion Rate Analysis
The value of tracking KPIs exceeds the cost enormously, providing deeper and more informed decision-making and improved performance.
They allow you to identify areas of strength and weakness within your operations, pointing you in the direction of your long-term goals.
As an example, the average conversion rate on Amazon is 9.87% —something to shoot for beating.
By learning these trends, you’ll be able to foresee what’s coming, make a better plan, and pivot when necessary.
By adapting based on your metric analysis, you can make sure that your strategy stays fresh and effective.
Add-to-Cart Rate Insight
Automated tools make it easier to track and analyze KPIs.
Unlike generic reporting solutions, these tools have comprehensive, real-time monitoring capabilities that will paint an immediate, vibrant, accurate picture of your performance.
Taking advantage of technology solutions both streamlines management of these KPIs and provides the flexibility to change course quickly based on data-driven insights.
Importance of Tracking KPIs
Keeping a healthy Amazon account is the foundation of success. Monitoring KPIs is vital, providing a clear comparison between actual and target values, highlighting areas needing attention.
Amazon KPIs are important in any e-commerce business, providing a big-picture look that helps you make smart, data-driven decisions.
Benefits for Sellers
Account health ratings indicate how well you’re following Amazon’s rules.
A high rating improves your credibility and increases visibility.
Staying on top of your account health rating with regular checks and proactive improvements are essential to achieving long-term success and building trust.
Insights from Seller Metrics
The Inventory Performance Index (IPI) measures the efficiency of your inventory.
An ideal IPI maximizes storage capacity and facilitates inventory management.
With IPI, you can be proactive, right-sizing your inventory and increasing efficiency across the board.
Automated Solutions for Monitoring
Order defect rate is a measure of customer satisfaction.
A low churn rate is essential for a healthy account.
Dealing with causes of defects upfront yields better customer experience, protecting account health.
A higher rank means your product is more visible in search results, making it easier for customers to find and buy it. It’s like being in the spotlight when your product ranks well.
This prized positioning wins the click of more shoppers and unlocks the most lucrative sales potential.
To do this, you need to get in front of these shoppers by optimizing your product listings. This means including appropriate keywords, high-quality images, and detailed descriptions that match what customers are searching for.
By improving your product rank, you open yourself up to a wider audience, which can lead to increased sales.
Inventory Performance Index Overview
Monitoring sessions on product detail pages is key to figuring out what’s working and what’s not.
Every session gives you actionable insights into how customers are behaving, allowing you to make informed marketing decisions.
By analyzing your session data, you can get a better picture of what’s working and what needs to be adjusted.
If your product page gets many visitors with few or no conversions, that’s a huge red flag.
You’ll need to make sure you have good images and pricing to drive conversions.
By identifying which sessions are performing well and which are not, you can adjust your strategy to increase customer engagement and conversions.
Order Defect Rate Explanation
For the record, the best seller rank is a measure of how popular a product is in a given category.
Having a completely optimized rank instills customer trust which in turn increases the likelihood of making a purchase.
To rank higher, focus on proven marketing tactics that draw attention to your product’s unique selling points and advantages.
Keeping your Order Defect Rate (ODR) low, under 1% if possible, helps you rank better, too.
By making sure products are shipped on time without excessive loss or damage, you help build your product’s reputation and attractiveness.
Product Ranking and Visibility
Product Rank Importance
Knowing why product rank on Amazon matters is crucial to success.
High rank = Visibility = More potential buyers = More sales.
Their formula for sales success is simple. Visibility is strictly granted or taken away by algorithms that prioritize sales velocity and customer reviews.
When you keep a low Order Defect Rate (ODR), you ensure good seller performance and a great reputation.
A low ODR keeps your products toward the top, so you’re making it easier for customers to find your listings.
Product page sessions are key for measuring demand. It’s a direct reflection of how much the users are searching for your product page.
The more sessions the better, as this often indicates increased visibility of your product.
Click-Through Rate (CTR)
Monitoring CTR allows you to gauge user engagement. Generally, a high CTR is a good sign of smart marketing.
To calculate CTR, simply divide clicks by impressions, then multiply by 100. The more compelling your product images and descriptions, the more sessions you gain.
Best Seller Rank Explanation
BSR is the metric that tells you a product’s sales rank in its category. A high BSR is an indicator of good sales.
Percentage Buy Box Fast Track, which is calculated at 80%, affects BSR.
A high BSR indicates a positive sales velocity and competitive edge. In addition to helping you avoid losing seller privileges, keeping a Late Shipment Rate (LSR) below 4% is in line with a positive BSR.
15 Essential Amazon KPIs: Calculations, Insights, and Performance Impact
KPI
Calculation
Insight Provided
Unit Session Percentage
(Number of Sales ÷ Total Number of Sessions) × 100
Measures conversion rate; how well traffic converts into sales.
Average Order Value (AOV)
Total Sales Revenue ÷ Number of Sales
Indicates how much revenue each order generates on average.
Advertising Cost of Sales (ACoS)
(Total Ad Spend ÷ Total Sales Revenue from Ads) × 100
Shows the efficiency of advertising; lower ACoS means more profitable ads.
Return on Ad Spend (RoAS)
Total Sales Revenue from Ads ÷ Total Ad Spend
Measures advertising profitability; higher RoAS means better returns.
Ad Conversion Rate
(Number of Ad Conversions ÷ Total Ad Clicks) × 100
Assesses how effective ads are at converting clicks into purchases.
Click-Through Rate (CTR)
(Number of Ad Clicks ÷ Total Ad Impressions) × 100
Indicates ad engagement; a higher CTR means ads are appealing.
Pre-Fulfillment Cancel Rate (PFCR)
(Number of Orders Cancelled Before Fulfillment ÷ Total Orders) × 100
Reflects order reliability; a high PFCR suggests inventory or pricing issues.
Order Defect Rate (ODR)
(Number of Orders with Defects ÷ Total Orders) × 100
Measures order quality; a high ODR can lead to account suspension.
Perfect Order Percentage
(Number of Perfect Orders ÷ Total Orders) × 100
Indicates operational excellence; higher values mean smoother transactions.
Late Shipment Rate (LSR)
(Number of Late Shipments ÷ Total Orders) × 100
Shows logistics efficiency; a high LSR may harm seller performance.
Valid Tracking Rate (VTR)
(Number of Orders with Valid Tracking ÷ Total Orders) × 100
Reflects shipping transparency; low VTR can impact customer trust and performance metrics.
Percentage Replenishable Out of Stock
(Number of Times Replenishable Items are Out of Stock ÷ Total Replenishable Items) × 100
Highlights inventory management efficiency; frequent stockouts can lead to lost sales.
Negative Experience Rate (NCX)
(Number of Negative Customer Feedbacks ÷ Total Orders) × 100
Measures customer satisfaction; high NCX can lead to lower rankings and account issues.
Buy Box Percentage
(Number of Times Winning the Buy Box ÷ Total Eligible Product Listings) × 100
Determines how often your products appear in the Buy Box, which directly impacts sales.
Customer Lifetime Value (CLV)
Average Order Value × Purchase Frequency × Customer Lifespan
Estimates long-term revenue per customer, helping in pricing, marketing, and retention strategies.
Key Points to Remember
Mastering Amazon KPIs is your ticket to not just surviving, but thriving in an increasingly competitive marketplace.
These metrics help you determine how to increase sales, optimize advertising efforts, and improve the customer experience.
Amazon KPIs are important key performance indicators that allow you to measure your store’s performance and inform smart business decisions. They take their measure of success to every corner of their selling world, delivering them a numbers-driven scorecard for performance.
Tracking KPIs allows you to assess the effectiveness of your marketing and sales strategies and set and achieve specific business goals. This data-driven approach facilitates continuous improvement and informed decision-making.
Concentrate on actionable metrics like sales performance indicators, advertising effectiveness metrics, and operational efficiency measures. These KPIs go to the heart of business expansion, economic development, and customer experience.
Consistently keep an eye on your sales performance to spot emerging trends and mold your future strategies based on what you see. Sales performance indicators sales kpis are a clear indicator of the business’s condition and are essential to long-term success.
Fine-tune your advertising strategies by comparing things such as organic sales percentage and return on ad spend (RoAS). By making strides in these key areas, we can achieve long term sustainable growth and reinvest our taxpayer resources more efficiently.
Monitoring customer engagement metrics will keep you on the path to success. Identify KPIs of sales velocity and add-to-cart rate in order to increase product discoverability and increase overall conversion rate. Regular KPI tracking is important for getting to big-picture business objectives in the long run.
Amazon KPIs: Frequently Asked Questions
What are Amazon KPIs?
Amazon KPIs, including important amazon seller performance metrics, are key performance indicators that successful sellers utilize to track various aspects of their business, such as sales, advertising, and customer engagement.
Why are Sales Performance Indicators Important?
Sales performance indicators are an obvious yet critical aspect of any amazon seller performance metrics report.
Metrics like conversion rates and average order value serve as important KPIs to baseline your revenue and understand your growth potential.
How can I Measure Advertising Effectiveness on Amazon?
To measure advertising effectiveness on the Amazon platform, track important Amazon advertising KPIs such as click-through rate (CTR), cost-per-click (CPC), and return on ad spend (ROAS).
These performance metrics help you understand how effective your ads are in drawing in and converting customers.
What are Operational Efficiency Measures?
These important amazon seller performance metrics track the efficiency of your operations.
Monitor inventory turnover rates, order fulfillment time, and returns processing to maintain efficient operations and customer satisfaction.
How do Customer Engagement Metrics Impact my Business?
Your customer engagement metrics—customer reviews and feedback—serve as important amazon seller performance metrics, giving you the pulse of customer satisfaction.
High engagement boosts rankings, leading to increased sales.
Why is Tracking KPIs Crucial for Amazon Sellers?
Measuring important Amazon KPIs is a key component of winning the performance optimization game.
Additionally, it can be used to track business strengths and weaknesses, allowing for data-driven decisions to improve sales, marketing, and overall customer performance metrics.
How can I Improve my Product Ranking and Visibility on Amazon?
Enhance your product listings by utilizing important amazon seller performance metrics such as relevant keywords, customer reviews, and competitive pricing to improve product ranking and visibility, ultimately boosting discoverability and sales.
With a passion for technology, Yulia writes about all things digital covering wide ranging topics such as digital marketing, finance and productivity. Contributing to BusinessTechWeekly.com regularly, Yulia has previously worked for a number of small and medium businesses in the finance, IT, and tourism sectors.